


 61 / 266

61
2014 Registration Document
Social responsibility
2
Results
INCOME
Customers
Partners
Financial income
Carrefour’s sales excluding VAT reached
€74,706 million
(excluding customer
loyalty programmes –
€609 million
).
€2,221 million
Other miscellaneous income for Carrefour:
income from financial companies, leasing
revenues and other.
Carrefour earned
€91 million
from
its financial and strategic investments
in the form of interest and dividends.
EXPENSES
Suppliers
Employees
Government and local
communities
Financial institutions
Shareholders
Carrefour spent
€64,225
million
on goods and
services from suppliers.
The Carrefour group paid
almost
€7,762 millio
n
to its 381,226 employees
in 10 countries. This
amount includes gross
salaries, social security
charges and benefits.
Carrefour paid
€1,333
million
in taxes, including
€800 million
in corporate
income tax.
Charges – mainly linked
to financial transactions –
were
€654
million.
The Carrefour group paid:
W
€149 million
in
dividends to parent
company shareholders;
W
€70 million
to minority
shareholders in other
Group companies.
2.3.2
Performance indicators
2.3.2.1
Global indicator
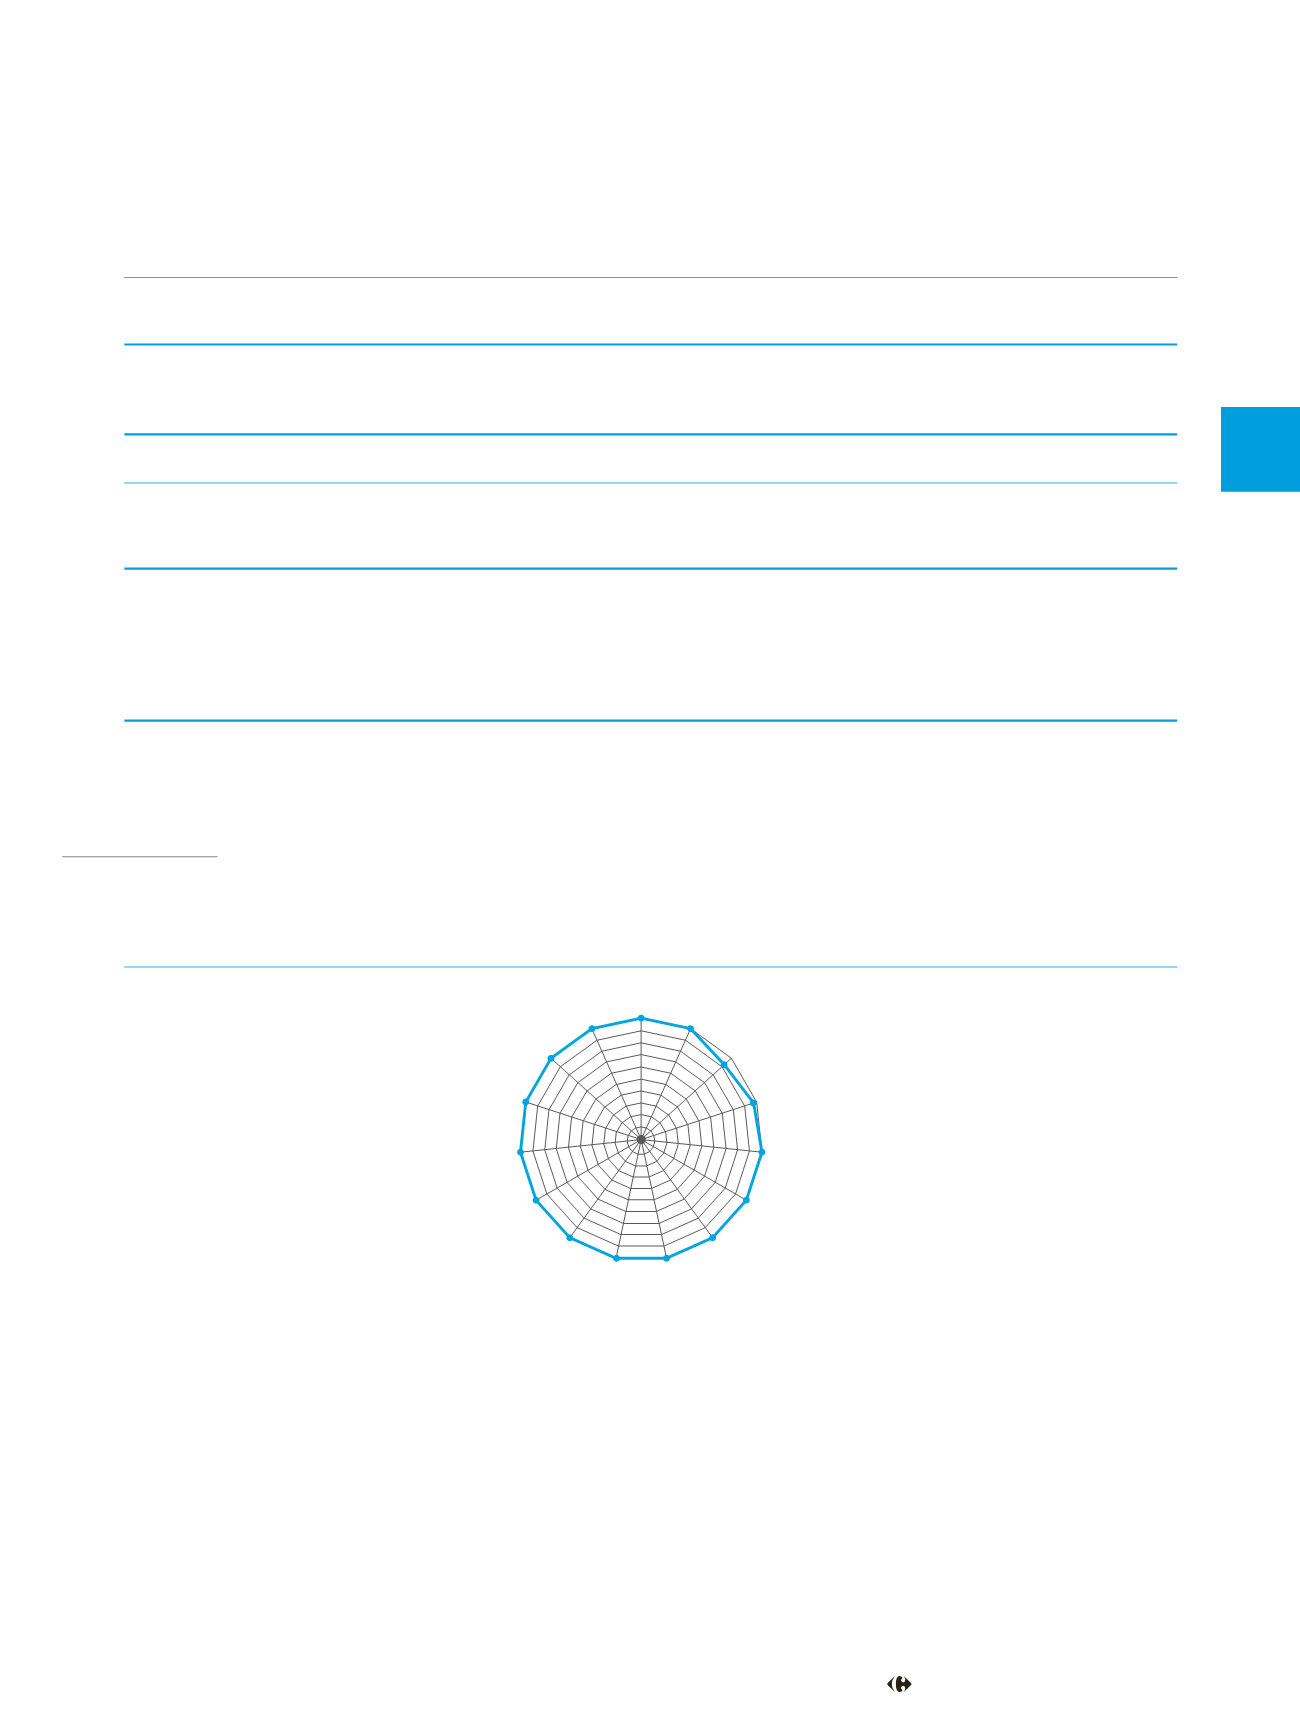
2014 SCOPE OF COVERAGE
Energy - 100%
Water - 100%
Waste - 92%
Refrigerants - 98%
Paper - 100%
Check-out bags - 100%
Organic products - 100%
Quality Lines - 100%
Local suppliers - 100%
Fair trade - 100%
Logistics - 100%
Accidents - 100%
Women
managers - 100%
Handicapped - 100%
Training- 100%
The average coverage of the 2014 reporting indicators is 99.39% of Group scope in terms of sales, excluding VAT.
The product, store and logistics indicators are calculated year-to-year, from October 2013 to September 2014.
The human resources indicators are calculated over the year 2014.
2.3.1.2
Sharing value with stakeholders
The data below provide a financial summary of the benefits of Carrefour’s financial results for stakeholders in 2014.