



 189 / 364

Social, societal and environmental responsibility
5.2 Information concerning Danone's social, societal and environmental performance in compliance with the Grenelle II law
DANONE
REGISTRATION DOCUMENT 2015
189
For the entire product lifecycle
Danone's total emissions in 2015 (including upstream agriculture)
are estimated at approximately 24.7 million tons of CO
2
equivalent
(on approximately 94% of Danone's sales volume).
Expressed in grams of CO
2
equivalent per kilogram of product,
Danone's emissions amount to:
•
Danone's direct responsibility scope: 215.5 grams of CO
2
equiv-
alent per kilogram of product (production, packaging, logistics,
product and packaging end of life);
•
total scope: 718.2 grams of CO
2
equivalent per kilogramof product
(Greenhouse Gas Emissions Scope, see
Methodology Note
), which
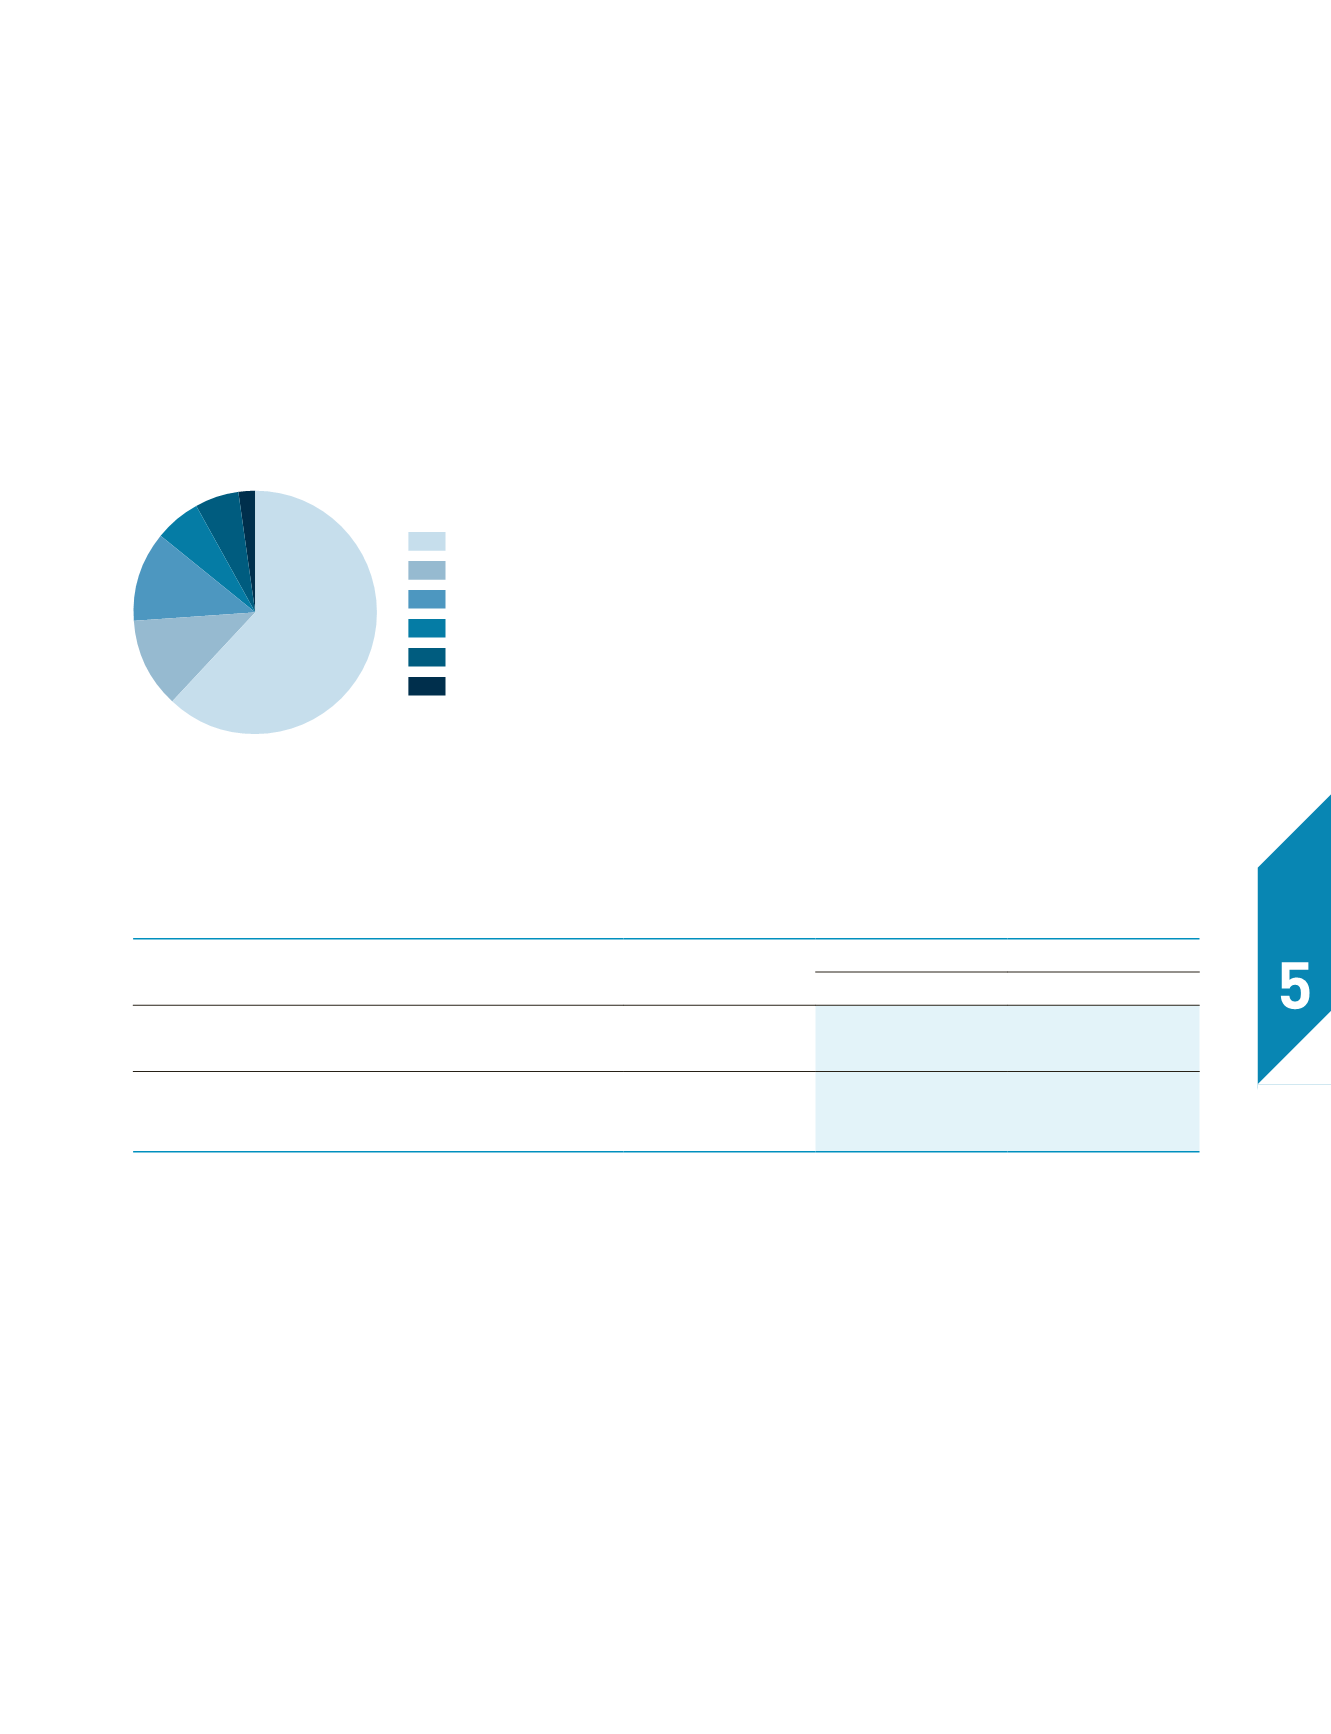
can be broken down by stage of the product lifecycle as follows:
Lifecycle breakdown
(in percentage)
Carbon offsets
Since 2011 Danone has teamed up with ten other large companies
through the Livelihoods Fund, whose mission is to invest in projects
that have a high environmental and social impact, including natural
ecosystem restoration projects. These projects help to combat
climate change by sequestering significant quantities of carbon
(see section 5.3
Funds sponsored by Danone
).
In line with its commitment and after reducing its carbon intensity by
40% over the 2008-2012 period, the e
vian
brand offset its remaining
emissions in 2012 by supporting several quality projects. Beginning
in 2013 and after consulting its stakeholders, the
evian
brand de-
cided to offset its emissions using the carbon credits issued by the
Livelihoods Fund, as and when they are distributed. By ramping up
these projects, Danone's goal is to gradually offset the
evian
brand's
emissions, which should therefore be fully offset as of 2020.
Greenhouse gas emissions by organization
Greenhouse gas emissions by organization (scope 1 and 2, see de-
scription hereafter) for 2015 are calculated using the methodology
described in the Greenhouse Gas Protocol (GHG Protocol) Corporate
Standard (see
Methodology Note
).
The approach chosen by Danone consists in integrating all sources
of emissions from Danone's industrial sites into the measurement
of its carbon footprint.
Direct emissions (scope 1) are emissions related to on-site fuel
consumption (natural gas, fuel oil, etc.) and refrigerant leaks.
Indirect emissions (scope 2) are emissions related to the production
of electricity, steam, heating and cooling purchased and consumed
by Danone.
In January 2015, the GHG Protocol published a guidance on the
method used to account for scope 2 greenhouse gas emissions,
which introduces a “dual reporting”:
•
a location-based reporting, i.e. based on greenhouse gas emis-
sions caused by the production of electricity in the geographical
region in which it is consumed;
•
a market-based reporting, i.e. based on companies operating
in liberalized markets such as the European Union which must
use the carbon emissions related to their electricity suppliers.
Year ended December 31
2015
(in tons equivalent CO
2
)
2014
location-based
market-based
Scope 1 emissions
561,353
561,641
561,641
Scope 2 emissions
860,404
915,747
928,645
Total emissions
1,421,757
1,477,387
1,490,286
Ratio of total emissions in kg of CO
2
equivalent per ton of product
44.4
43.3
43.7
The ratio of total emissions in kg of CO
2
equivalent per ton of production (location-based ratio) decreased by 2.4% between 2014 and 2015.
Adapting to the consequences of climate change
Danone estimates the impacts of climate change to complete the
overall risk identification and management policy described in
section 2.7
Risk factors
.
For example, Danone has identified medium-term risks in the
following areas:
•
supply of raw materials (milk, fruit, etc.) in certain regions of
the world related to possible droughts and inclement weather;
•
cold production at the Fresh Dairy Products Division's sites in
case of a significant rise in temperatures;
•
unusual climate events that could affect some industrial sites
located near coastlines.
12%
6%
6%
2%
62%
12%
Raw materials
Packaging
Production
Logistics
Distribution
Product end of life