



 186 / 364

Social, societal and environmental responsibility
5.2 Information concerning Danone's social, societal and environmental performance in compliance with the Grenelle II law
DANONE
REGISTRATION DOCUMENT 2015
186
Within the Fresh Dairy Products Division, best practices, partic-
ularly the use of water in cleaning cycles, are consolidated in the
NEPTUNE application and deployed on sites.
Within the Waters Division, the “WaterWatcher” tool allows moni-
toring of water use at the bottling sites and helps identify areas of
improvement. This tool has been implemented in all theDivision's sites.
The sites measure all quantities of water consumed for each use
(production, cleaning, etc.) in order to identify loss-generating areas
and come up with appropriate action plans to reduce these losses.
The sites have annual targets to reduce their water losses. Their
performance and rankings are published quarterly at each Division.
Since 2008, approximately 25 million m
3
of water have been saved.
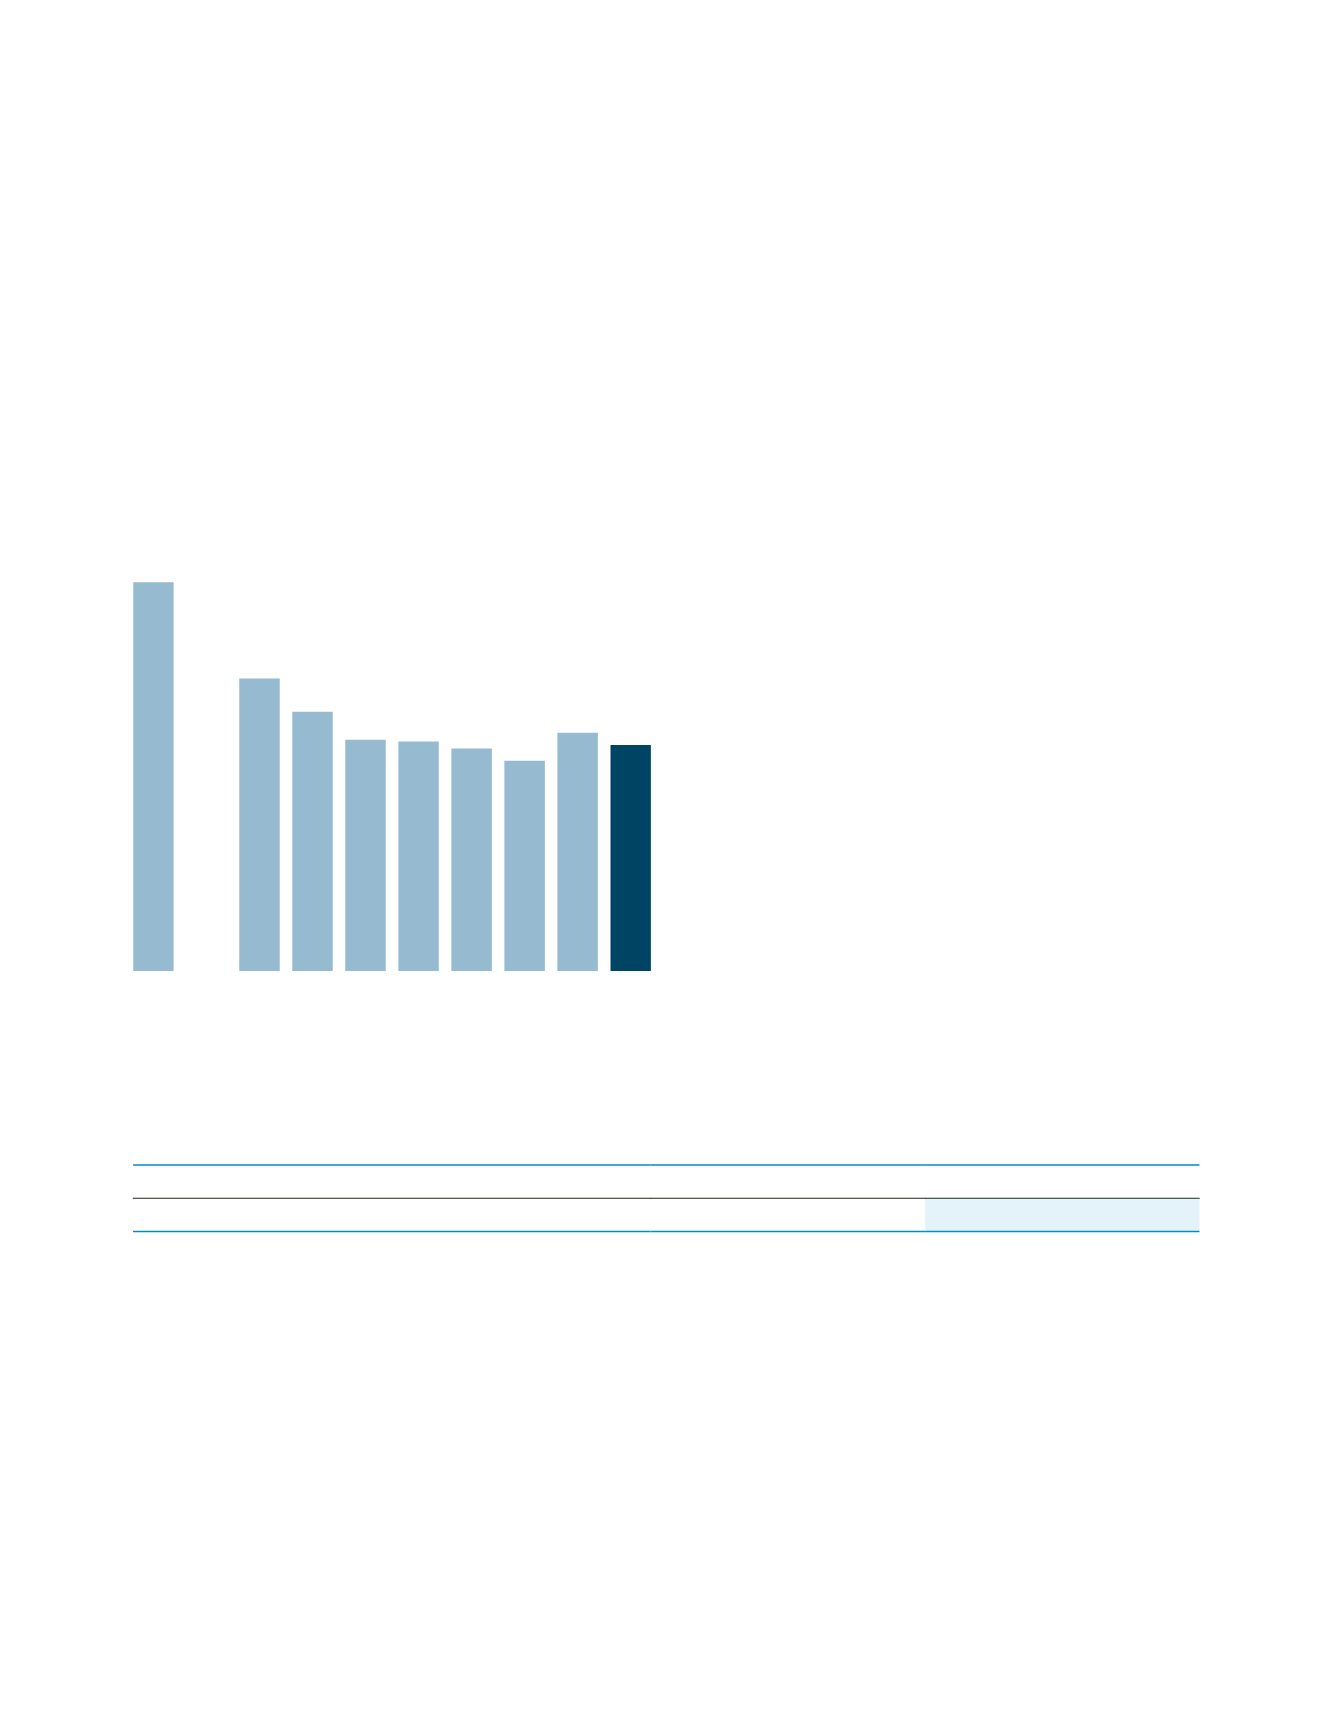
The following graph shows changes in water consumption intensity
related to Danone's industrial process since 2000, for the reporting
scope of each of the years concerned.
Water consumption intensity related to the production process
(in m
3
/ton of product)
2000
2008 2009 2010 2011 2012 2013 2014 2015
2.22
1.67
1.48
1.32 1.31 1.27
1.2
1.36
1.29
Calculation of the water footprint taking into account local
water stress
In 2015, Danone continued its specific water footprint research, par-
ticularly as part of the WULCA (Water Use in Life Cycle Assessment)
international research group.
This methodology for evaluating the water scarcity footprint takes
into account:
•
the inventory of consumption at each stage of product development
(ingredients, containers, production and packaging), transport,
consumer use and end of life;
•
local water stress factors (water stress is defined as the poten-
tial to deprive another user, human or ecosystem by consuming
water in the area in question).
This methodology is already implemented in the Waters Division
and a pilot project was successfully conducted in 2015 in Poland
to incorporate this indicator into the SAP module currently used to
measure the carbon footprint of products.
In the future, this evaluation methodology will make it possible to
identify sensitive areas and ways to reduce impacts on the entire
product life cycle, starting with the Waters Division.
There has been no scientific consensus yet regarding the water
quality deterioration footprint.
Consumption of raw materials and measures taken to improve their efficient use
Information on risk management, particularly with respect to risks related to seasonal fluctuations and raw materials availability, is
provided in section 2.7
Risk factors
.
Production at the production sites
Year ended December 31
(in thousands of tons)
2014
2015
Production
(a)
32,023
34,094
(a) Production Site Environment Scope (see
Methodology Note
).
Danone's production sites produced the equivalent of 34million tons
of products in 2015, up 6.5% relative to 2014. The changes in scope
(see
Methodology Note
) accounted for 3.0%of this increase, and growth
in production volumes on a like-for-like basis accounted for 3.5%.
The main raw materials consumed in Danone's products are:
•
water;
•
liquid milk and powdered milk;
•
packaging materials (plastic, cardboard, etc.);
•
sugar;
•
fruit.