


 9 / 28

08 09
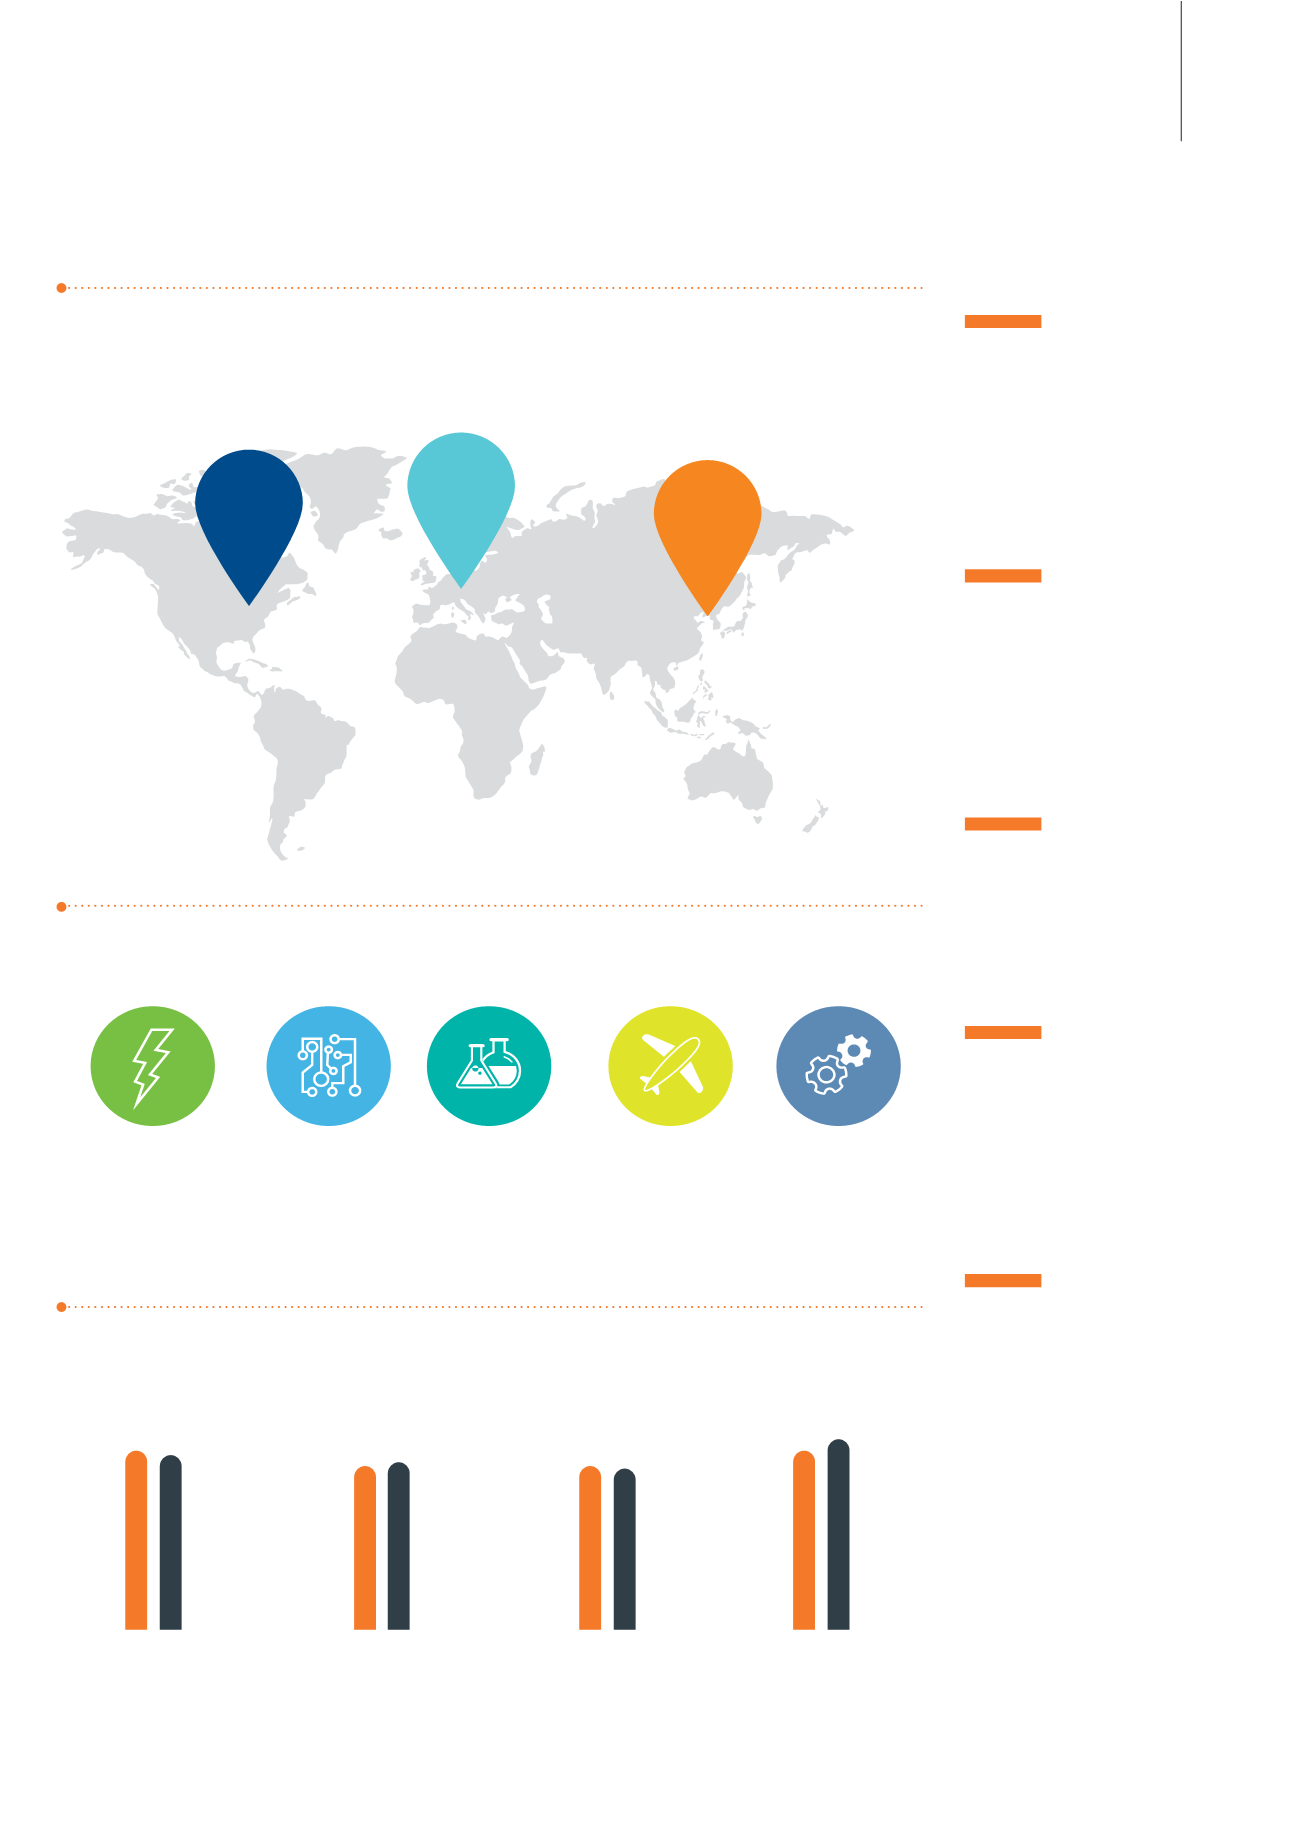
Sales by
geographical
region
Sales by
market
18%
Energy
18%
Electronics
13%
Chemicals
16%
Transportation
35%
Process Industries
Consolidated sales
(in millions of euros)
Reccuring
operating margin
(as a % of sales)
Net cash
generated
by continuing operating
activities*
(in millions of euros)
Dividend
(in euros)
2013
2013
2013
2013
739
8.1%
86
0.45
731
8.2%
79
0.50**
2014
2014
2014
2014
* before capital expenditure and exceptional items
** subject to shareholders’ aprroval
38%
35%
27%
Europe
Asia &
rest of the world
North America
Highlights
+2%
organic
growth in sales
(excluding
Chemicals)
Slight
improvement
in recurring
operatingmargin
Transformplan
successfully
deployed
Strong cash
flowbefore
non-recurring
items
Dividend up
11%