


 95 / 104

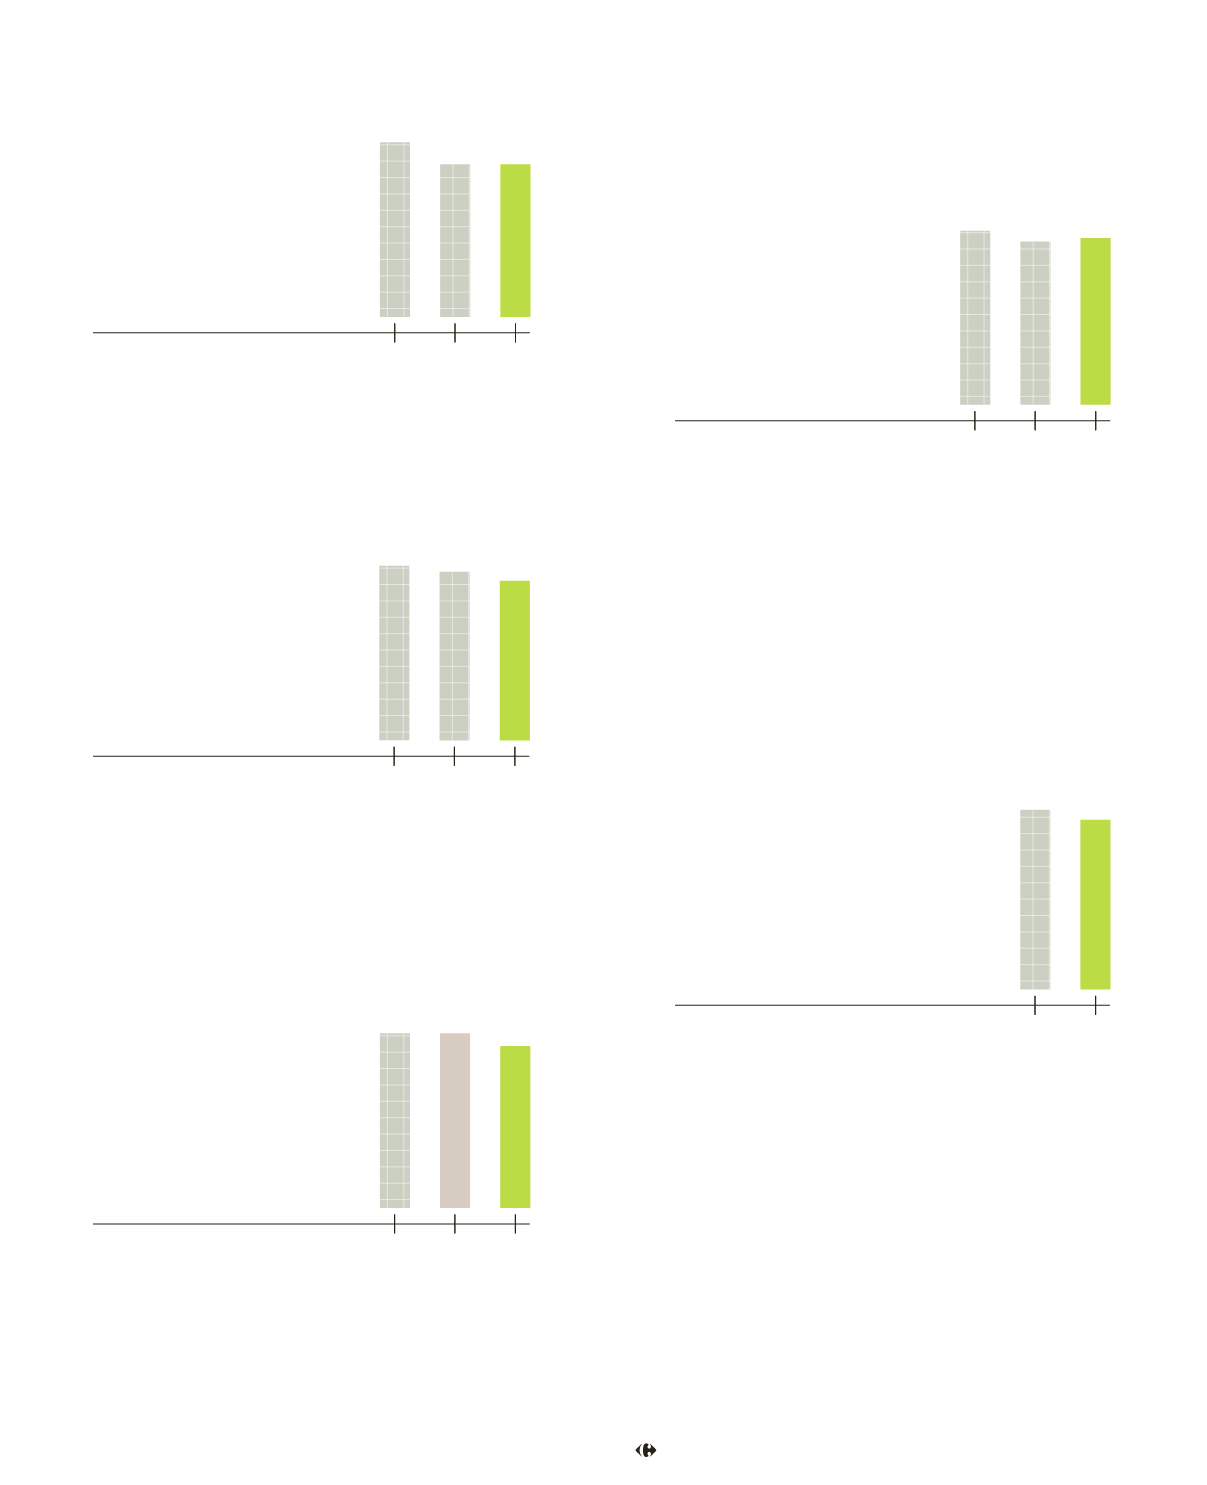
Total emissions (in millions of t. CO
2
eq.)
Data on a like-for-like BU basis (100% of 2014 consolidated net sales).
In 2014, CO
2
emissions fell by 0.6% vs 2013 with the
1/2/3 scope of distribution remaining stable, with
efforts to reduce CO
2
consistent across the board. The
Group has set a goal to reduce its CO
2
emissions by
40% by 2020, as compared with 2009 levels in four
European countries (France, Spain, Italy and Belgium,
representing 38%of the Group’s emissions). Initiatives
in place since 2009 have led to CO
2
emissions falling
by 30.5%.
3.60
3.58
2013 2014
Greenhouse gaz emissions
CO
2
emissions per transport unit (in kg CO
2
/pallet)
Data on a like-for-like BU basis (85% of 2014 consolidated net sales.
Excluding hypermarkets and supermarkets in Brazil).
The many initiatives launched by Carrefour (optimised
lorry loads, fewer empty returns, clean vehicles, etc.)
led to a 7% reduction in CO
2
emissions per pallet
transported in 2014 (vs 2013).
6.9 6.9
6.4
2013
2012
2014
CO
2
emissions
per transported pallet
Quantity of refrigerant refilled due to leakage
(in kg/1,000 sq. m. of sales area)
Data on a like-for-like BU basis (96% of 2014 consolidated net sales.
Excluding hypermarkets and supermarkets in Argentina).
With Carrefour’s commitment to halt the use of hydro-
fluorocarbons (HFCs) in new refrigeration systems
starting in 2015, the new fluids generatedmore leakage
(+2.1% in comparison to 2013). Nevertheless, CO
2
emissions per sq. m. of sales area associated with
refrigerant consumption fell by 6.8%as compared with
2013, due to the new fluids’ lower impact on potential
global warming. Carrefour is also gradually replacing
its commercial cold production facilities with facilities
that use natural fluids.
50.8 47.7
48.7
2013
2012
2014
Consumption of refrigerants
Quantity of paper purchased for commercial publications
(in kg/sq. m. of sales area)
Data on a like-for-like BU basis (100% of 2014 consolidated net sales).
Carrefour is continuing its efforts to reduce the quantity
of paper purchased for its commercial publications,
with the goal of reaching 100% use of recycled or
certified paper (99.3%at the end of 2014).
18.3
16.0
16.0
2013
2012
2014
Paper consumption
Quantity of water consumed (in cubicm./sq. m. of sales area)
Data on a like-for-like BU basis (91% of 2014 consolidated net sales.
Excluding hypermarkets and supermarkets in Belgium and Argentina).
Within one year, additional water conservation of 5.8%
per sq. m. of sales area was achieved, with a total of
15.5 million cubic metres consumed in Group stores.
Stores around theworld are gradually adopting solutions
to limit water consumption, such as motion-detection
taps and systems for collecting and recycling rainwater.
1.74 1.68
1.59
2013
2012
2014
Water consumption
95
2014 annual activity and responsible commitment report –